Travelling through deep time to find copper for a clean energy future
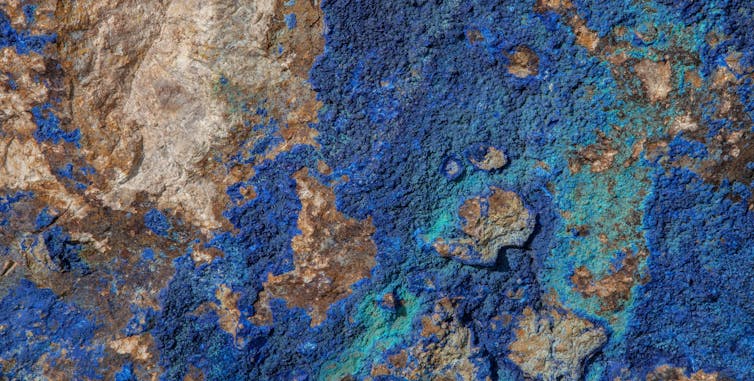
 Stunning mosaic of oxidised copper in the form of azurite (blue) and malachite (green) in a rock.
Dimitri Houtteman, Author provided
Dietmar Müller, University of Sydney; Jo Condon, The University of Melbourne; Julian Diaz, University of Sydney, and Rohitash Chandra, UNSW
More than 100 countries, including the United States and members of the European Union, have committed to net-zero carbon emissions by 2050. The world is going to need a lot of metal, particularly copper.
Recently, the International Energy Agency sounded the warning bell on the global supply of copper as the most widely used metal in renewable energy technologies. With Goldman Sachs predicting copper demand to grow up to 600% by 2030 and global supply becoming increasingly strained, it is clear we need to find new and large deposits of copper fast.
Getting this much copper will be impossible unless we discover significant new copper deposits. But there has been little exploration for copper over the past decade, as prices have been relatively low.
We have been developing software to model Earth in four dimensions to look deep inside the planet and back into the past to discover where copper deposits formed along ancient mountain ranges. This software, called GPlates, is a powerful four-dimensional information system for geologists.
How large copper deposits form
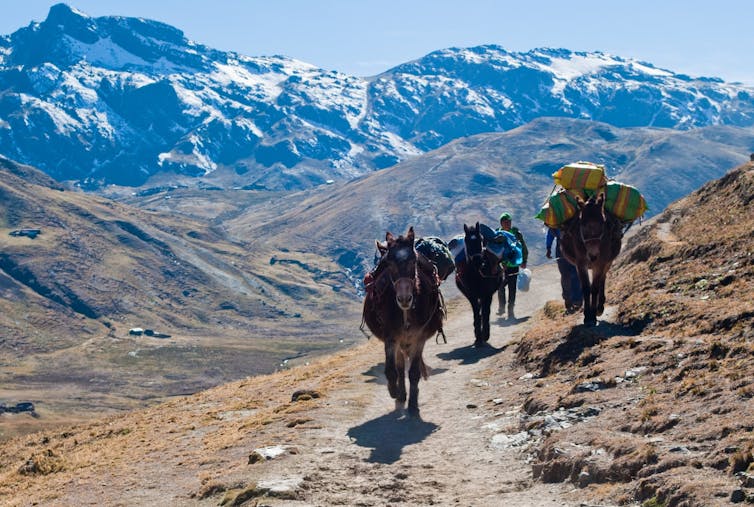
Many of the world’s richest copper deposits formed along volcanic mountain chains such as the Andes and the Rocky Mountains. In these regions, an oceanic tectonic plate and a continent collide, with the oceanic plate sinking under the edge of the continent in a process called subduction.
 Mountain ranges like the Andes are formed through subduction and can be rich in copper deposits.
Adèle Beausoleil / Unsplash
This process creates a variety of igneous rocks and copper deposits to form along the edge of the continent, at depths of between one and five kilometres in the crust, where hot magmatic fluids containing copper (and other elements) circulate within networks of faults. After millions of years of further plate movement and erosion, these treasures move close to the surface – ready to be discovered.
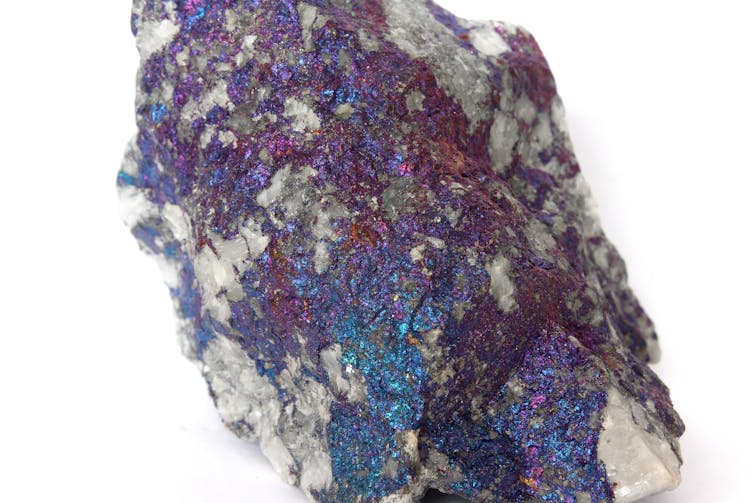
 A sample of copper hosted in a quartz vein in the form of a mineral called chalcopyrite. When exposed to air, the surface oxidises to create this metallic ‘peacock’ lustre.
Marek Novotňák / Wikimedia Commons
Searching for copper
Geologists typically use a set of well-established tools to look for copper. These include geological mapping, geochemical sampling, geophysical surveys and remote sensing. However, this approach does not consider the origin of the magmatic fluids in space and time as the driver of copper formation.
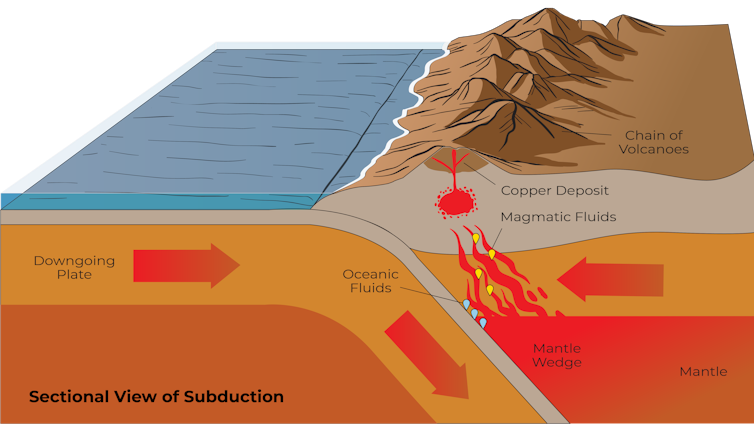
We know these magmatic fluids come from the “mantle wedge”, a wedge-shaped piece of the mantle between the two plates that is fed by oceanic fluids escaping from the downgoing plate. The oceanic plate heats up on its way down, releasing fluids that rise into the overlying continental crust, which in turn drives volcanic activity at the surface and the accumulation of metals such as copper.
 Copper deposits tend to form above subduction zones along volcanic chains. This schematic is not to scale.
Modified from Shutterstock
Differences in how subduction occurs and the characteristics of the oceanic plate may hold the secret to better understanding where and when copper deposits form. However, this information is traditionally not used in copper exploration.
Building a virtual Earth
At the EarthByte research group, we are building a virtual Earth powered by our GPlates plate tectonic software, which lets us look deep below the surface and travel back in time. One of its many applications is to understand where copper deposits have formed along mountain belts.
In a recent paper, we outline how it works. We focus on the past 80 million years because most of the known economic copper deposits along mountain belts formed during this period. This period is also most accurate for our models.
We used machine learning to find links between known copper deposits along mountain belts and the evolution of the associated subduction zone. Our model looks at several different subduction zone parameters and determines how important each one is in terms of association with known ore deposits.
So what turns out to be important? How fast the plates are moving towards each other, how much calcium carbonate is contained in the subducting crust and in deep-sea sediments, how old and thick the subducting plate is, and how far it is to the nearest edge of a subduction zone.
Plate motions and age of the ocean crust, with age-coded porphyry copper-gold deposits overlaid. Animation by Michael Chin.
Using our machine learning approach, we can look at different parts of the world and see whether they would have experienced conditions conducive to forming copper deposits at different times. We identified several candidate regions in the US, including in central Alaska, southern Nevada, southern California and Arizona, and numerous regions in Mexico, Chile, Peru and Ecuador.
Knowing when copper ore deposits may have formed is important, as it helps explorers to focus their efforts on rocks of particular ages. In addition, it reveals how much time given deposits might have had to move closer to the surface.
Australia has similar deposits, including the Cadia copper-gold district in New South Wales. However, these rocks are significantly older (roughly 460 million to 430 million years old) and require virtual Earth models to look much further back in time than those applied to the Americas.
Read more:
5 rocks any great Australian rock collection should have, and where to find them
The future of mineral exploration
Finding 10 million tonnes of copper by 2030 – the equivalent of eight of the largest copper deposits that we mine today – presents an enormous challenge.
With support over a decade from AuScope and the National Collaborative Research Infrastructure Strategy (NCRIS), we are in a position to imagine tackling this challenge. By supercharging GPlates in Australia’s Downward Looking Telescope, together with AI and supercomputing, we can meet it head on.
These emerging technologies are increasingly being used by Australian startups like Lithodat and DeeperX and mining companies in collaboration with universities to develop AI’s enormous potential for critical minerals discovery.
Read more:
Clean energy? The world’s demand for copper could be catastrophic for communities and environments

Dietmar Müller, Professor of Geophysics, University of Sydney; Jo Condon, Honorary researcher, The University of Melbourne; Julian Diaz, Exploration Geologist, University of Sydney, and Rohitash Chandra, Senior Lecturer, UNSW
This article is republished from The Conversation under a Creative Commons license. Read the original article.